RichyHBM
Software engineer with a focus on game development and scalable backend development
My Many Iterations for the Perfect Self-Hosted Dashboard
Well, It’s been quite some time since my last post. So much so in fact that we’ve had a global pandemic and various life events between then and now! Since my last post, and with a little spare time we have all had, I have been heavily getting into self-hosting, and by extent sysops/homelabs, one of which services that soon becomes controversial is the choice of what dashboard to use. In this post I will detail some of the options I have tried out.
Flame
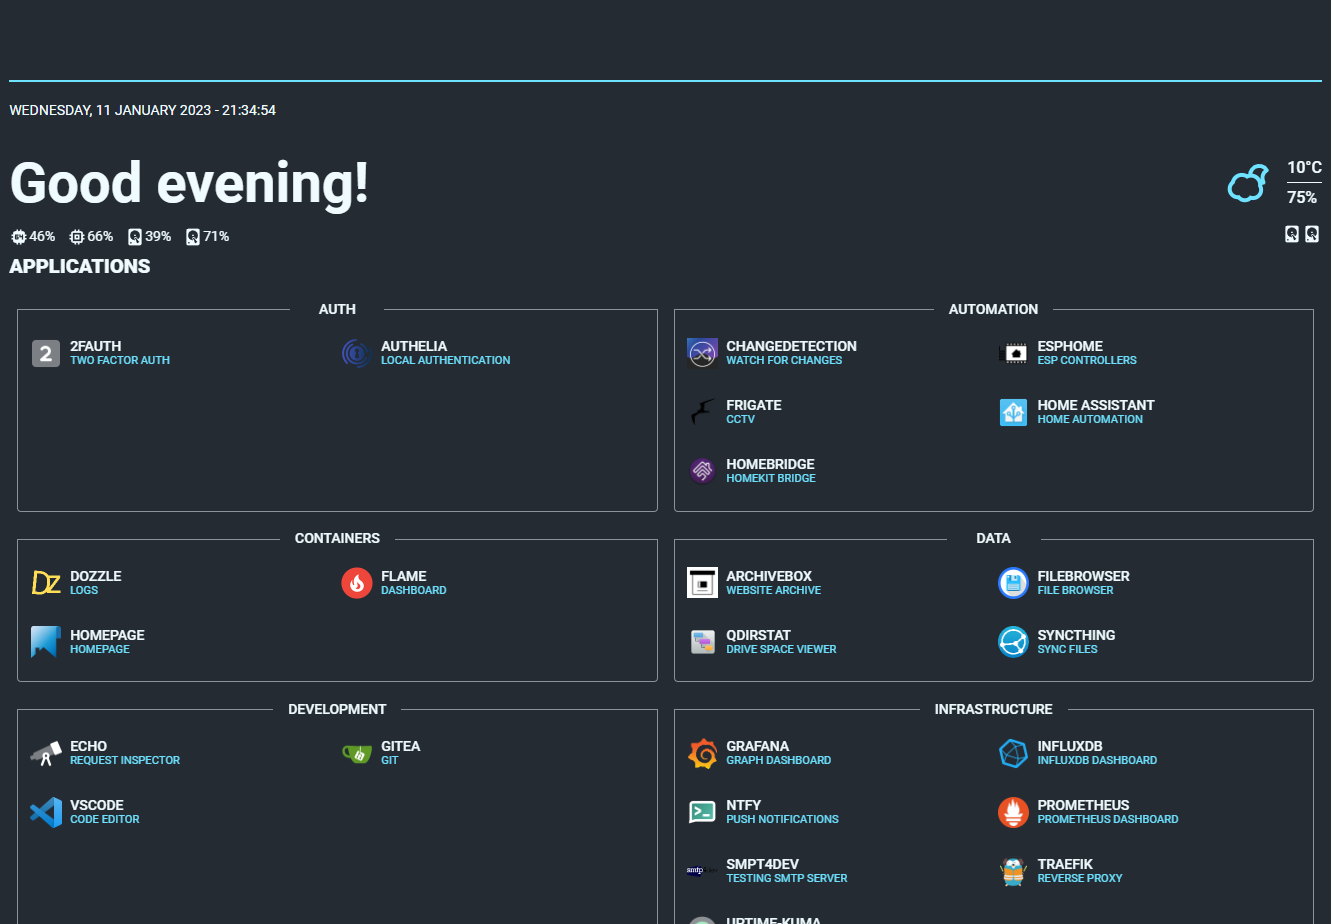
After trying out a number of dashboards, I decided to use a custom fork of Flame, flame is a clean minimalistic dashboard that allows you to list your services via either UI configuration, or using docker labels.
However over time I got a bit bored of the supplied features and instead decided to fork the project to add some more features, including:
- Service grouping/categories
- Gotify notification alerts
- Scrutiny HDD health indicators
- Glance system stats
- Service descriptions/sub-title
Homepage
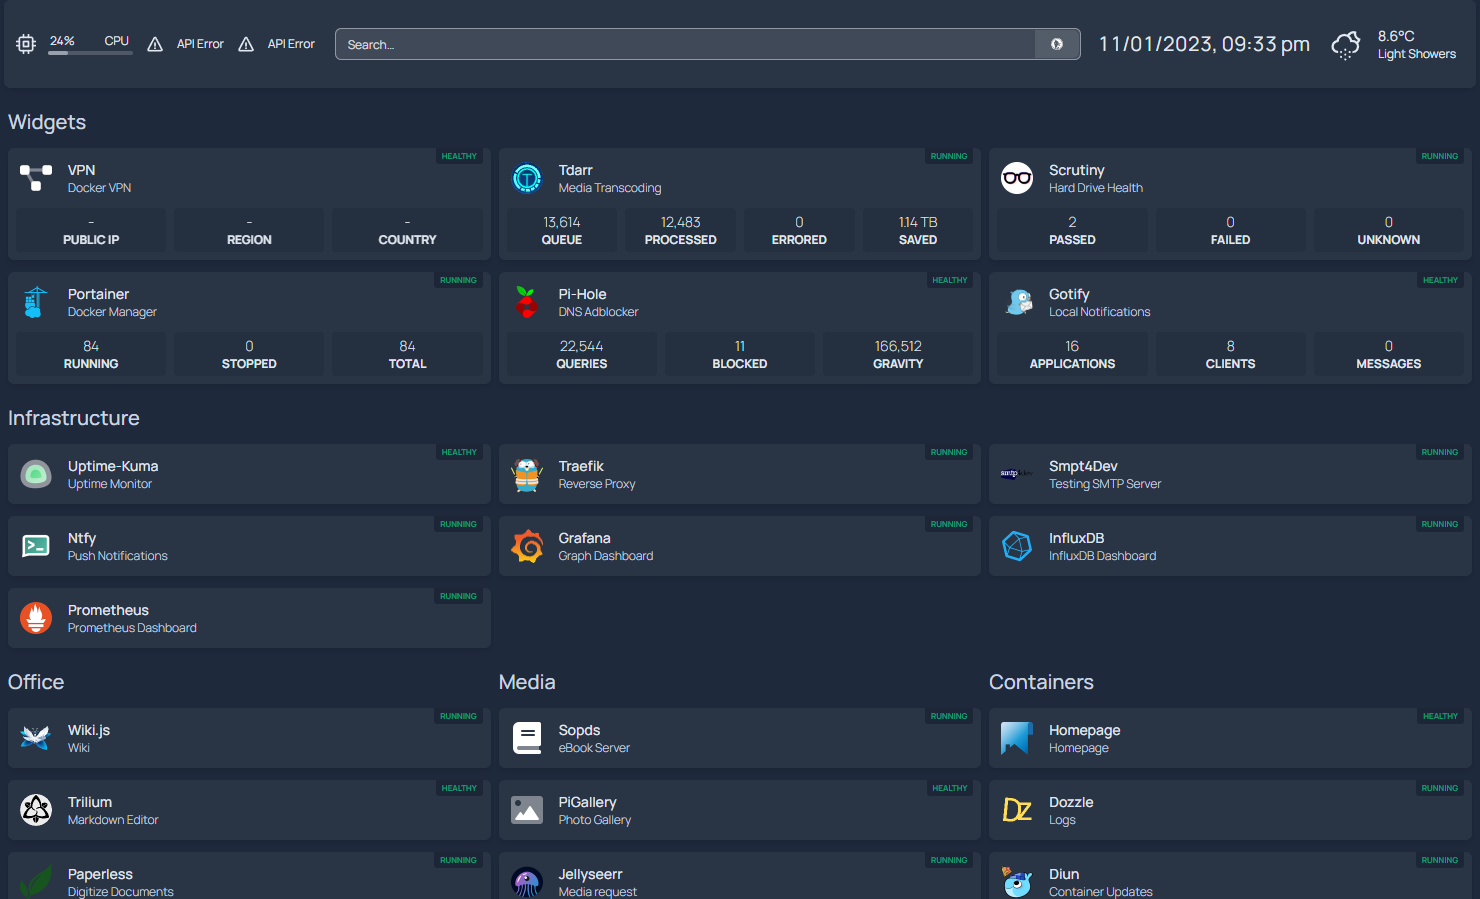
After flame, I found Homepage which had better integration for a bunch of services I already used, could populate its data via docker labels, and supported other types of widgets.
Homepage is simple to use, and has a great amount of features, as well as a good development community meaning you will hopefully be able to have any features missing integrated quickly.
One of the best things I find I get out of the many dashboards I have tried, are the ability to quickly, at a glance, see all the different stats and states of the services I run. Homepage is great for this as it has many different widgets for lots of services, and adding new ones is fairly simple though it does require a rebuild, and so for most use cases a new docker image update.
Saying that, homepage is great and seems to just work. Whilst other options with more features exist, I find homepage is my choice for a go to out of the box dashboard that doesnt really need much/any additional setup
Grafana
My latest dashboard is a custom one created within Grafana, this isn’t specifically designed as a self-hosted dashboard but rather a way to display data and metrics, usually on a timeline basis. But given the right data, it allows displaying much more information than any of the out of the box dashboards I have found thus far.
Grafana, by its self, doesn’t fetch or store any data, it only displays it. So in order to store and fetch data, I also make use of the TIG stack, Telegraf, InfluxDB, and Grafana, as well as also using Prometheus as a secondary fetcher/DB. This is mainly because Prometheus and Telegraf fetch different data sets, though in the future, and whilst I’m only running on the 1 hardware machine, I may look at using just Prometheus.
As well as these, I also run a few micro services to fetch data from other running services and pipe this into Prometheus, this allows me to store their stats and then view them in Grafana, giving me a dashboard with all the data I want!
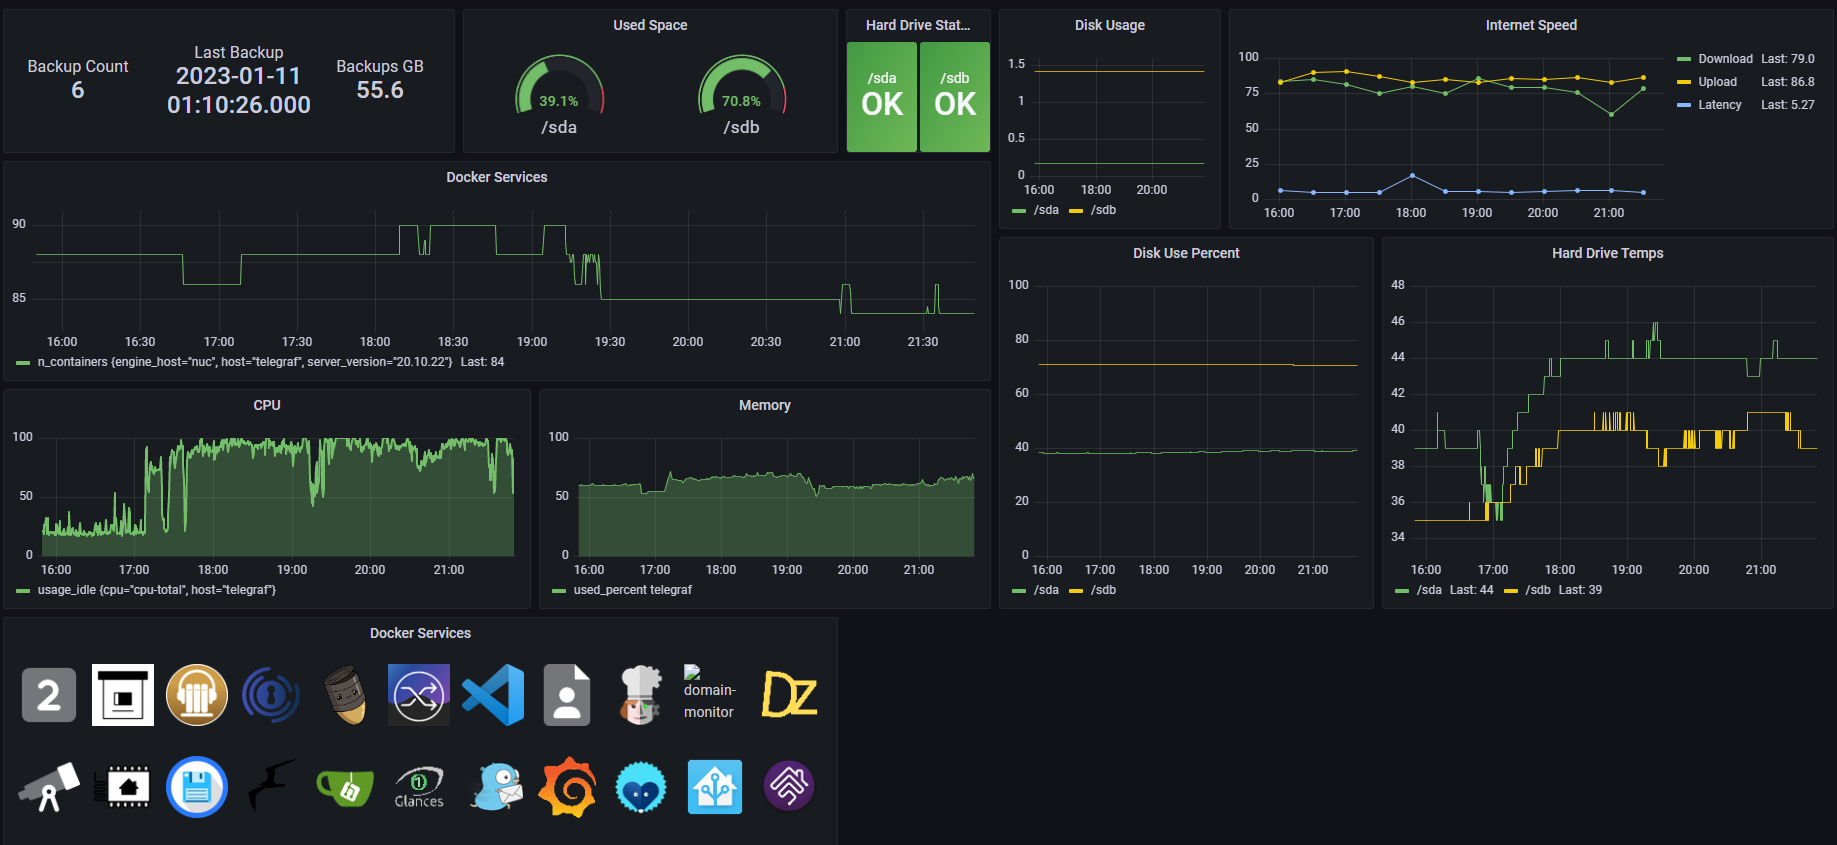
My current Grafana setup is relatively simple, but you can find some really cool dashboards built within grafana on the self-hosted or homelab subreddits!